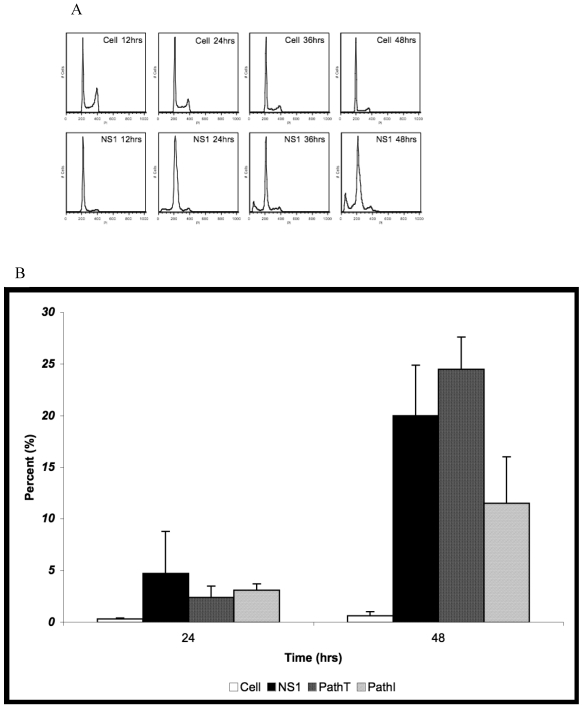
Figure 3.
Cell Cycle Analysis for SubG1 Content. (A) Representative fluorescence intensity plots for propidium iodide emission demonstrating the cell cycle distribution of mock-transduced control (top) and NS1 (bottom) expressing HepG2 cells at 24 and 48 hrs post-transduction. (B) Quantitative graphic representation of HepG2 cell cycle distribution for mock, NS1, PathT and PathI in the SubG1 phase of the cell cycle. The data represents at least two independent experiments with bars demonstrating the standard deviation between the individual runs. One star (*) indicates statistically significant (p < 0.05) change between Cell and marked set. Two stars (**) - statistically significant (p< 0.05) change between NS1 and marked set. Three stars (***) - statistically significant (p< 0.05) change between PathT and marked set.

