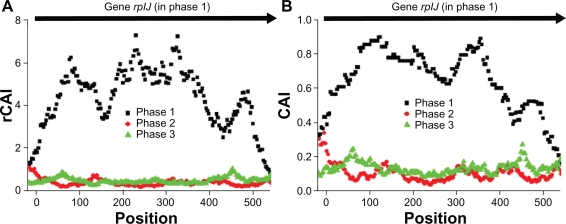
Figure 3.
Signal-to-noise ratio of rCAI and CAI on coding regions. Distribution of local rCAI A) and CAI B) values on an L. lactis gene, rplJ. Phase 1 matches the coding frame. For phases 2 and 3, rCAI and CAI were calculated on triplets beginning at the +1 nucleotide and +2 nucleotide of the coding frame, respectively. The rplJ gene is shown in full length and starts at position 1 of the x axis.

