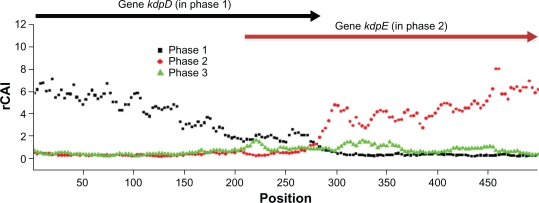
Figure 5.
rCAI distribution across the overlapping region of two C. crescentus genes, kdpD and kdpE. Only parts of the two genes are shown with the overlapping region zoomed in. Phase 1 matches the coding frame of the upstream gene kdpD, and phases 2 and 3 start at the +1 and +2 nucleotides of phase 1, respectively. The coding frame of kdpE lies in phase 2. rCAI computed on phase 1 dominates over that of phase 2 in the region of overlap.

