Figure 1.
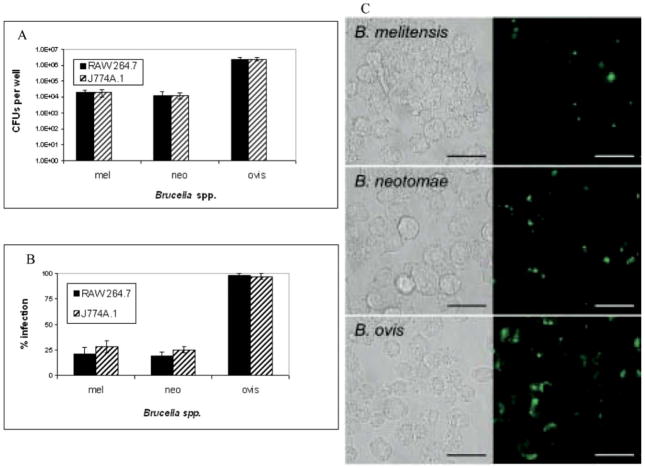
Intracellular survival of Brucella spp. in RAW 264.7 and J774A.1 macrophages. Panel A. Intracellular Brucella spp. were isolated from RAW 264.7 or J774A.1 macrophages and enumerated at 4 hr. Macrophages were infected with 1000:1 MOI of each Brucella spp. and allowed to infect for 90 min followed by gentamicin treatment for 30 min. At 4 hr, macrophages were washed then lysed with 0.1% Triton X-100. Intracellular Brucella were enumerated by plating serial dilutions on agar. Four independent experiments were conducted, and the number of Brucella spp. isolated per well was averaged with error bars representing the SEM. Comparing B. melitensis or B. neotomae to B. ovis infection is significantly different with P ≤ 0.005. Panel B. Flow cytometry analysis of Brucella-GFPuv infection in RAW 264.7 and J774A.1 macrophages at 4 hr. RAW 264.7 or J774A.1 macrophages were infected for 90 min with Brucella spp. containing GFPuv followed by gentamicin treatment to remove extracellular bacteria. After 4 hr, RAW 264.7 or J774A.1 cells were fixed in 4% paraformaldehyde, and the percent of infected cells determined by flow cytometry analysis. Comparing B. melitensis or B. neotomae to B. ovis infection is significantly different with P ≤ 0.005. Panel C. RAW 264.7 macrophages were infected continuously for 4 hr with Brucella spp. containing GFPuv. Cells were washed to remove extracellular Brucella and fixed in 4% paraformaldehyde. Matched bright field and fluorescence images were digitally captured at ×63 oil immersion magnification. Bar equals 20 μm. A color version of this figure is available in the online journal.

