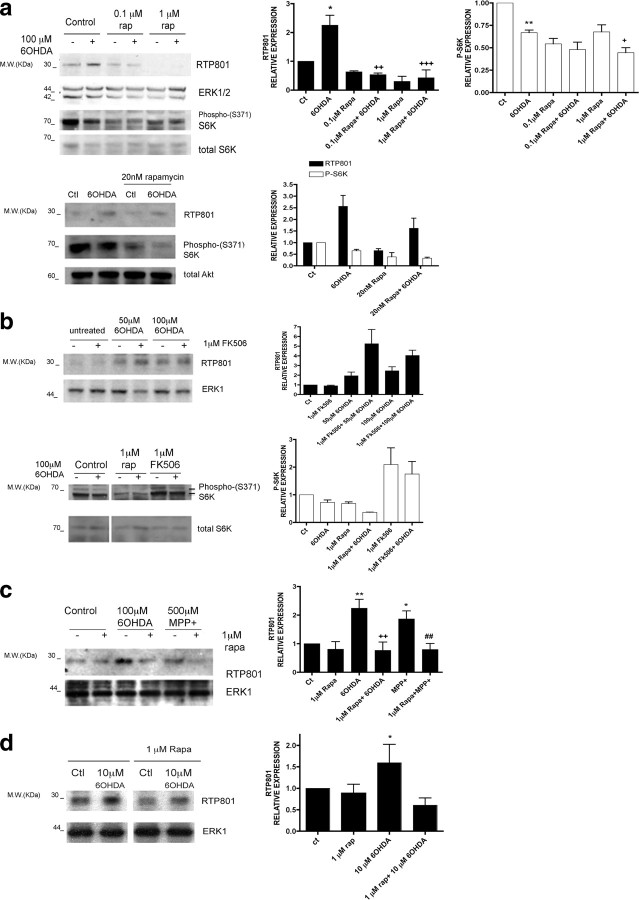
Figure 2.
Rapamycin blocks upregulation of RTP801 protein by PD mimetics. a, Neuronal PC12 cells were pretreated with or without 0.1 or 1 μm rapamycin (top) or with 20 nm rapamycin (bottom) and exposed to 100 μm 6-OHDA for 8 h. Cell extracts were subjected to SDS-PAGE and Western immunoblotting. Membranes were probed with the indicated immunoreagents and reprobed with antibodies for ERK1/2 or total Akt as loading controls. Right panels show quantification (means ± SEM) from three or more independent experiments. RTP801 relative expression (normalized to ERK1/2): *p < 0.05 versus untreated control (Ct) cultures; ++ p < 0.01, +++ p < 0.001 versus 6-OHDA-treated cultures. phospho-S6K relative expression (normalized to ERK1/2): **p < 0.01 versus untreated control cultures; + p < 0.05 versus 6-OHDA-treated cultures. b, Neuronal PC12 cells were pretreated with or without 1 μm rapamycin or 1 μm FK506 and then exposed to 100 μm 6-OHDA for 8 h. Cell extracts were subjected to SDS-PAGE and Western immunoblotting. Membranes were probed with the indicated immunoreagents and reprobed with antibodies for total S6K and ERK1. The vertical white line between lanes in b (bottom) indicates elimination of irrelevant intervening lanes in the blot. c, Neuronal PC12 cells were pretreated with or without 1 μm rapamycin and then exposed to 100 μm 6-OHDA or 500 μm MPP+ for 8 h. Cell extracts were subjected to SDS-PAGE and Western immunoblotting. Membranes were probed with the indicated immunoreagents and reprobed with an antibody for total ERK1 as loading control. Right panel shows quantification (means ± SEM; normalized to ERK1/2) from three or more independent experiments. RTP801 relative expression: *p < 0.05, **p < 0.01 versus untreated control cultures; ++ p < 0.01 versus 6-OHDA-treated cultures; ## p < 0.01 versus MPP+-treated cultures. d, Sympathetic neuron cultures were pretreated with or without 1 μm rapamycin and then exposed to 10 μm 6-OHDA for 16 h. Cell extracts were analyzed by Western immunoblotting with the indicated immunoreagents. Right panel shows quantification (means ± SEM; normalized to ERK1/2) from three or more independent experiments. RTP801 relative expression: *p < 0.05 versus untreated control (Ctl) cultures. The vertical white line between lanes indicates elimination of irrelevant intervening lanes in the blot.

