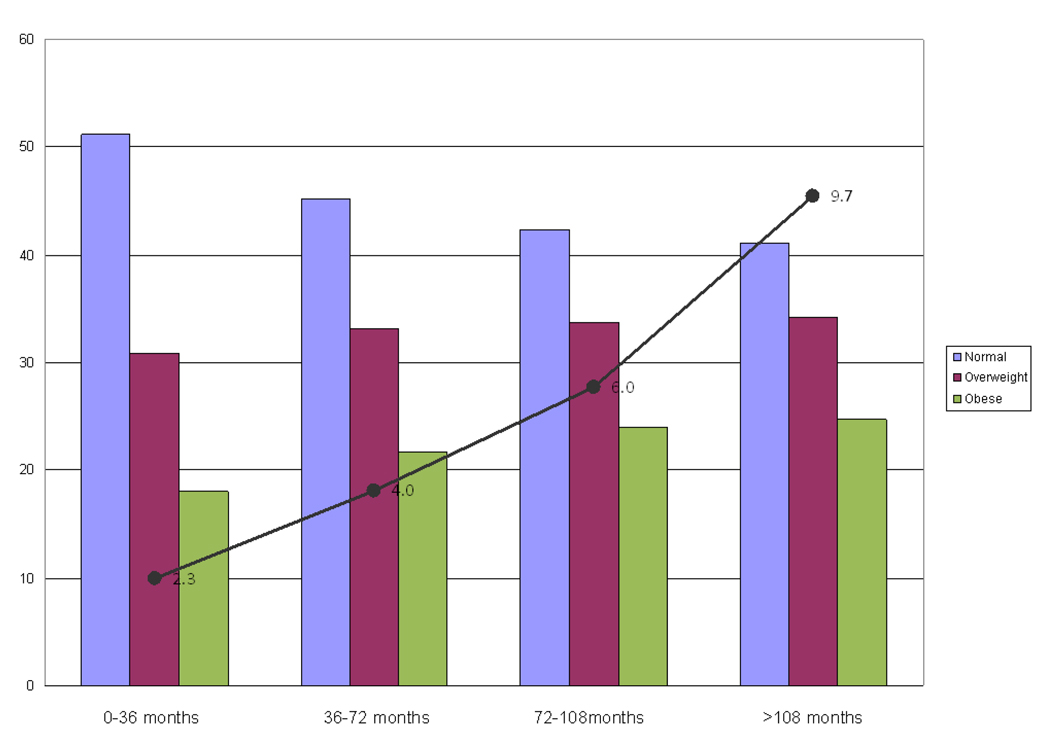
Figure 2.
Incident AF and Percent of women in each WHO Category over 3 Year Time Periods. Shown is a bar graph of the percent of women in each WHO category at the beginning of four 36 month time periods over the course of the study. The incidence rate of AF (per 1000 participants per period) for each 36 month time period is superimposed on the graph for comparison.

