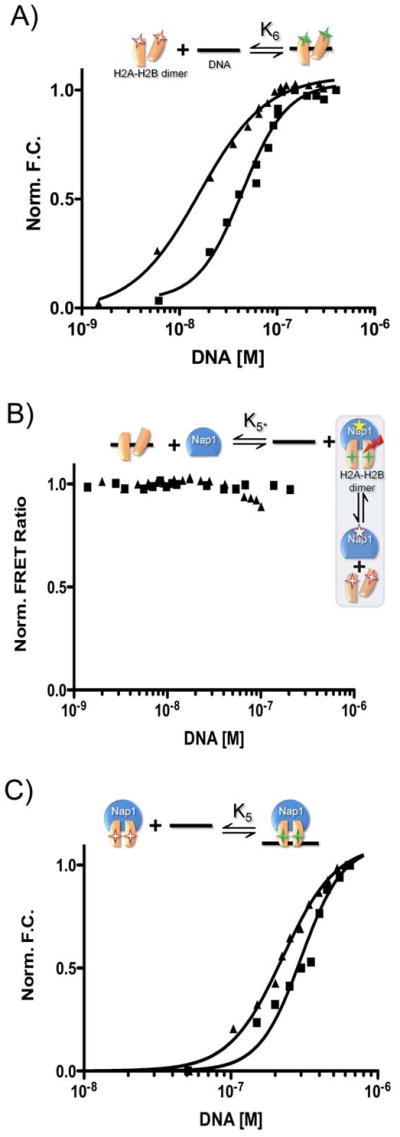
Figure 4. Nap1 disfavors the interaction between H2A–H2B dimer and DNA.

The experimental design for each reaction is shown above each panel, using the symbols described in Fig. 1. Fluorescent labels are indicated by asterisks; FRET is indicated by a red arrow. Closed squares are 601-tetrasomes; closed triangles are 5S-tetrasomes. (A) Normalized fluorescence as a function of DNA binding to H2A–H2B. (B) The change in FRET between Nap1 and H2B as a function of DNA. The experiment was originally designed to confirm K6; however, the data indicate the Nap1-H2A–H2B complex remains intact in the presence of DNA and thus the small amount of signal change is due to DNA binding to the Nap1-H2A–H2B complex. Therefore, the binding event really monitored is K5, and is thus termed K5*. (C) Fluorescence change as a function of DNA binding to a Nap1-H2A–H2B complex (Nap1 is 10-fold > K2). Binding constants derived from the shown experiments are summarized in Table 1. See supplemental information for experimental details.
