
Figure 1. Myc-induced increases in protein synthesis regulate B lymphocyte size, division and apoptosis prior lymphomagenesis.
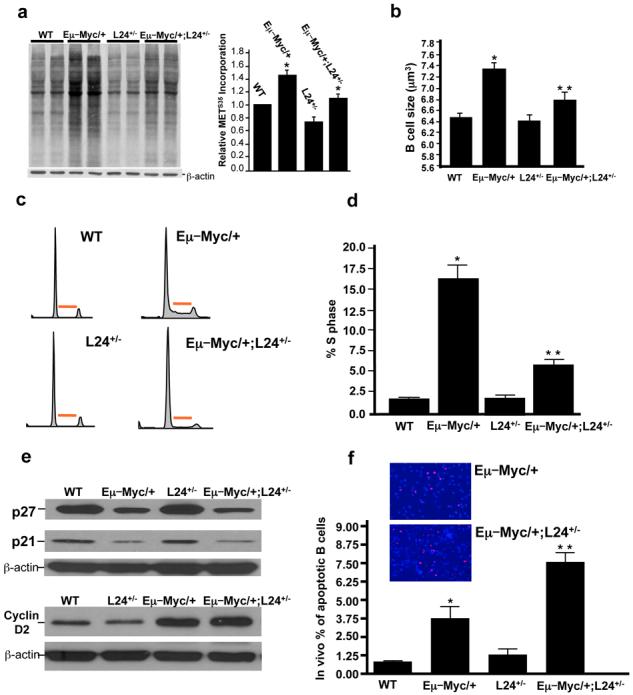
a, Protein synthesis rates assessed by S35 methionine incorporation and densitometry analysis (n=3) * p < 0.01. b, Cell size analysis (n=3) * p < 0.001 for Eμ–Myc/+ versus WT, ** p < 0.01 for Eμ–Myc/+ versus Eμ–Myc/+;L24+/−. c, d, Cell cycle distribution and quantification of the percentage of cells in S phase (n=3). Red bar indicates S-phase, * p < 0.01, ** p < 0.05. e, Western blot analysis for cell cycle targets transcriptionally regulated by Myc f, In situ Tunnel analysis (n=3). Inserts are representative pictures of Tunnel analysis comparing Eμ–Myc/+ and Eμ–Myc/+;L24+/− samples * p < 0.05, ** p < 0.05. a-e, all experiments were performed on freshly isolated B-lymphocytes. Error bars, s.d.