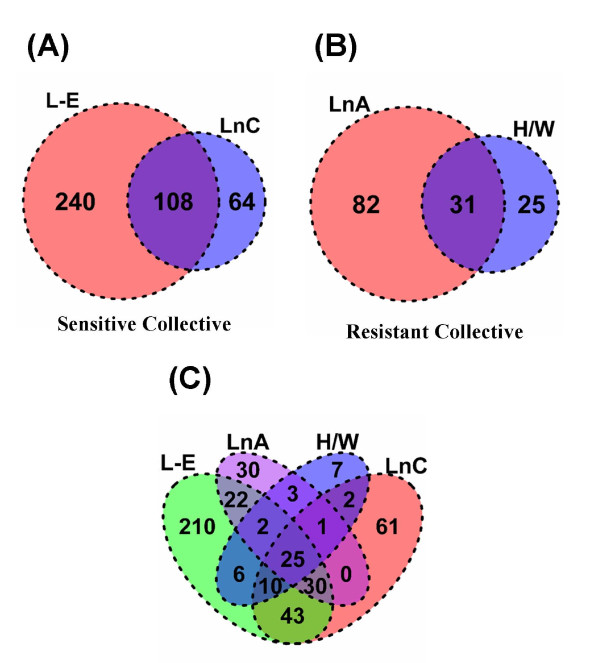
Figure 3.
Overlap of altered transcripts between rat strains/lines. We generated Venn diagrams to visualize the overlap of significantly (padjusted < 0.01) altered transcript responses to 100 μg/kg TCDD for 19 hours between the sensitive and resistant collectives: (A) across the sensitive collective, (B) across the resistant collective and (C) across all four strains/lines.

