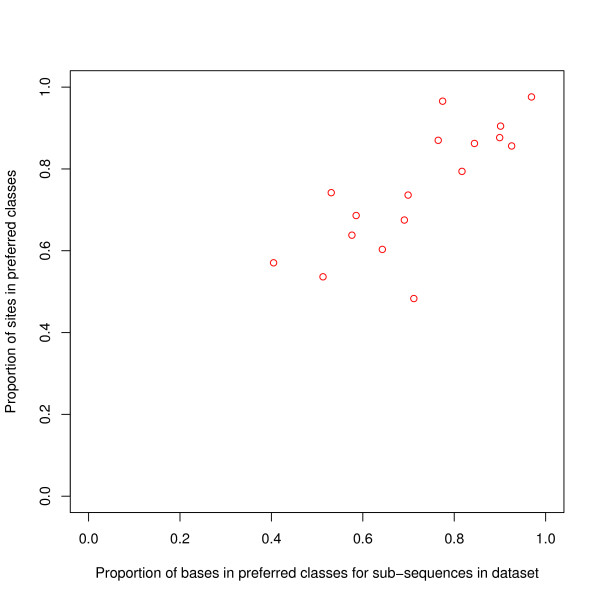
Figure 3.
Binding sites versus entire subsequences -- proportion of bases in the preferred classes. For each transcription factor, the proportion of binding sites in the preferred classes has been plotted against the proportion of all bases in the preferred classes in all the sequences of the dataset. The latter proportion has been calculated for each sequence separately and then averaged over the sequences of the dataset. There is a strong relationship between the plotted variables: the correlation coefficient is 0.78.

