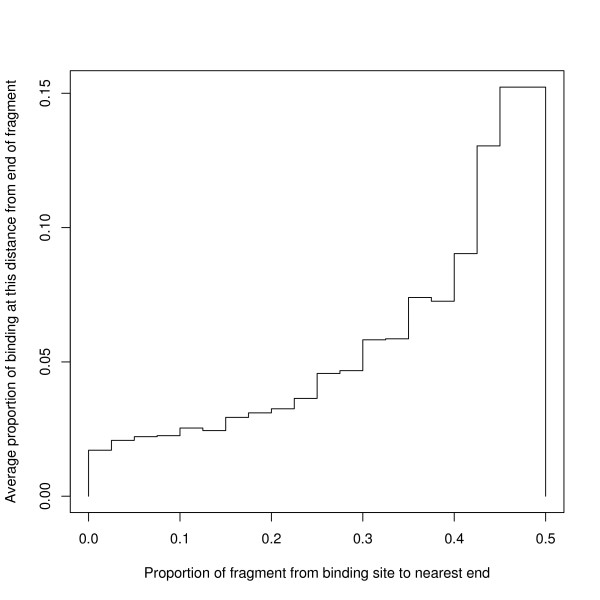
Figure 4.
Position of binding site within subsequence. For each binding site, we have calculated p = the number of bases to the nearer end of the subsequence divided by the length of the subsequence; and for each dataset we have calculated the histogram of these proportions. The Figure shows the average heights of the histograms of individual datasets and shows a strong tendency for the binding site to be in the middle of the subsequence.

