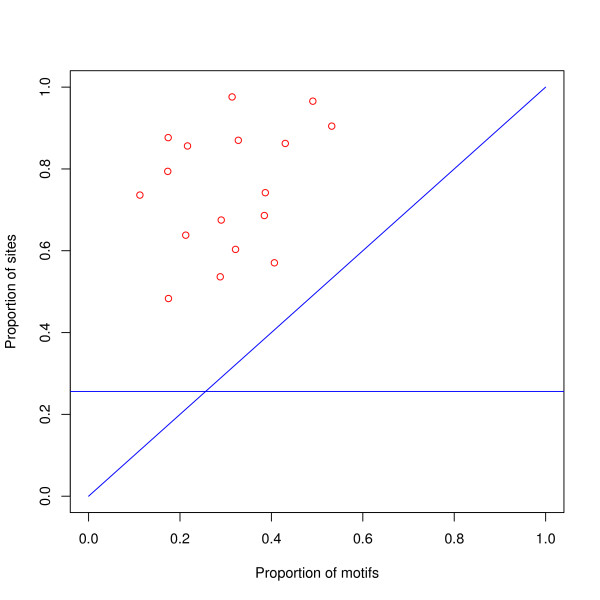
Figure 6.
Proportion of binding sites versus proportion of motifs in the preferred classes. For each of the 17 transcription factors, the proportion of binding sites in the preferred classes has been plotted against the proportion of motifs in these classes. The height of the horizontal line gives the proportion of all bases in the genome in these classes. The Figure shows that for the preferred classes the proportion of sites is greater than the proportion of motifs: it also shows that the proportion of motifs is not a good predictor of the proportion of sites for these classes. It can also be seen that the proportion of sites is greater than the proportion of the genome in the preferred classes.

