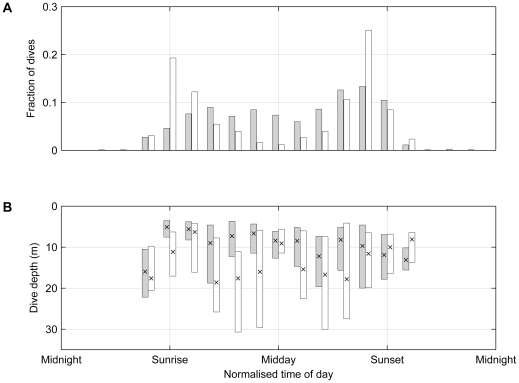
Figure 4. Diel distributions of sooty shearwater diving activity.
A. Distributions of sooty shearwater dives with respect to time of day. B. Dive depths with respect to time of day. The median (cross) and interquartile range (bars) are shown. Grey bars indicate dives made from 30°S–50°S, and white bars indicate dives made south of 50°S.

