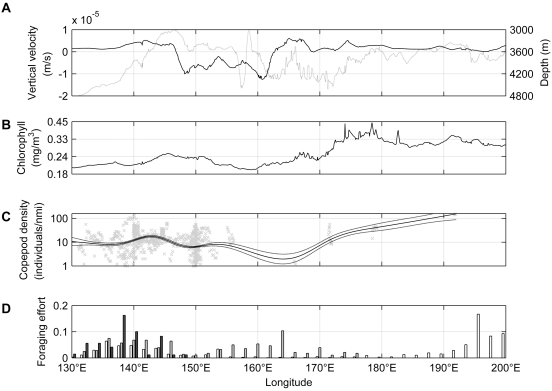
Figure 7. Shearwater foraging in the Polar Frontal zone, in relation to oceanographic processes and copepod abundances.
A. Longitudinal distributions in the Polar Frontal zone of water vertical velocity at 1095m depth (solid line, positive = upward) and water depth (dotted). B. Mean summer surface chlorophyll-a from SeaWiFS satellite estimates. C. Near-surface copepod density from continuous plankton recorder surveys (points = individual tow segments, black lines = mean±SE fit by generalised additive model). D. Shearwater relative foraging effort within 3° of latitude of the Polar Frontal zone (white = sooty shearwaters, black = South Australian short-tailed shearwaters, grey = Tasmanian short-tailed shearwaters).

