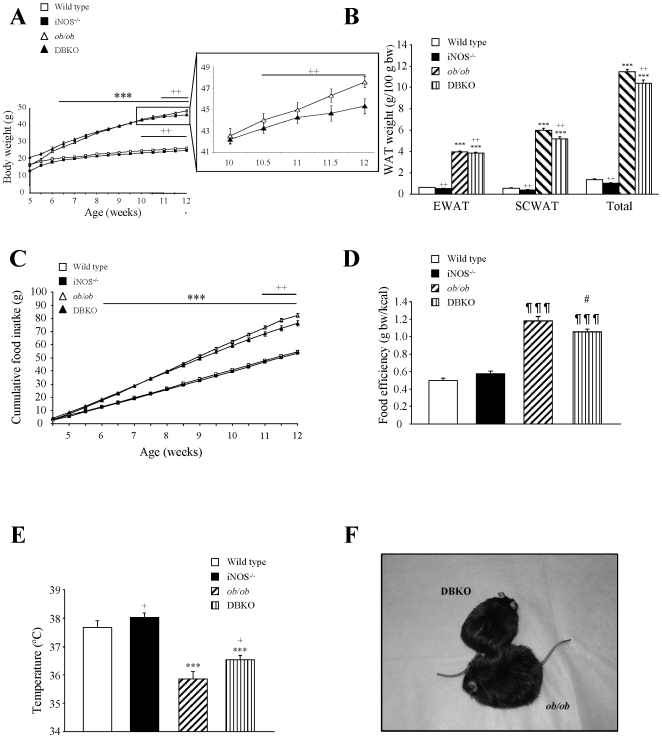
Figure 1. Growth and metabolic variables of mice of the four experimental groups.
Growth curves of 4–12 week-old-mice (A) together with epididymal (EWAT), subcutaneous (SCWAT) and whole-body fat content (B) of the experimental animals. Cumulative food intake (C), food efficiency (D) and rectal temperature (E) are also shown. Representative images illustrating the differences in size between 12-week-old ob/ob and DBKO mice (F). Values are the mean ± SEM (n = 10 per group). Differences between groups were analyzed by two-way ANOVA. ***p<0.001, effect of the absence of the ob gene. +p<0.05, ++p<0.01, effect of the absence of the iNOS gene. One-way ANOVA followed by Tukey's post hoc test was applied for variables with interaction between factors. ¶¶¶p<0.001 vs wild type, #p<0.05 vs ob/ob mice. EWAT, epididymal white adipose tissue; SCWAT, subcutaneous white adipose tissue; WAT, white adipose tissue; bw, body weight.

