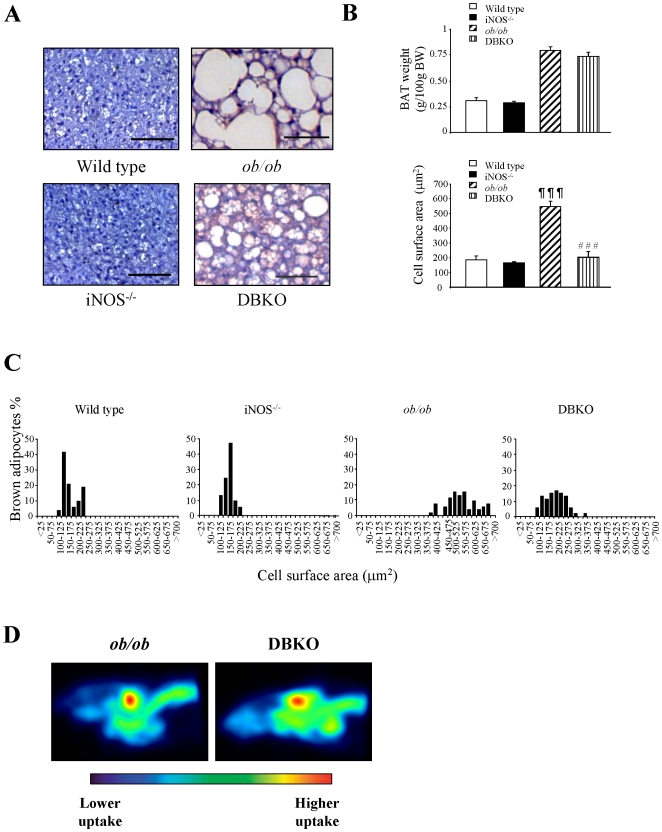
Figure 2. Phenotype of BAT of the experimental groups.
(A) Representative histological sections of BAT stained with hematoxylin-eosin. Magnification X100 (scale bar = 50 µm). BAT weight, general cell surface area (B), and mean values (C) of the cell surface area in relation to the percentage of brown adipocytes contributing to the final cell size in each of the experimental groups. Values are the mean ± SEM (n = 6 per group). (D) MicroPET scans depicting interscapular BAT uptake of experimental animals using 18F-FDG as a probe; signals are shown in %ID/g at the region of interest over the background. Differences between groups were analyzed by one-way ANOVA followed by Tukey's post hoc test. ¶¶¶p<0.001 vs wild type, ###p<0.001 vs ob/ob mice.

