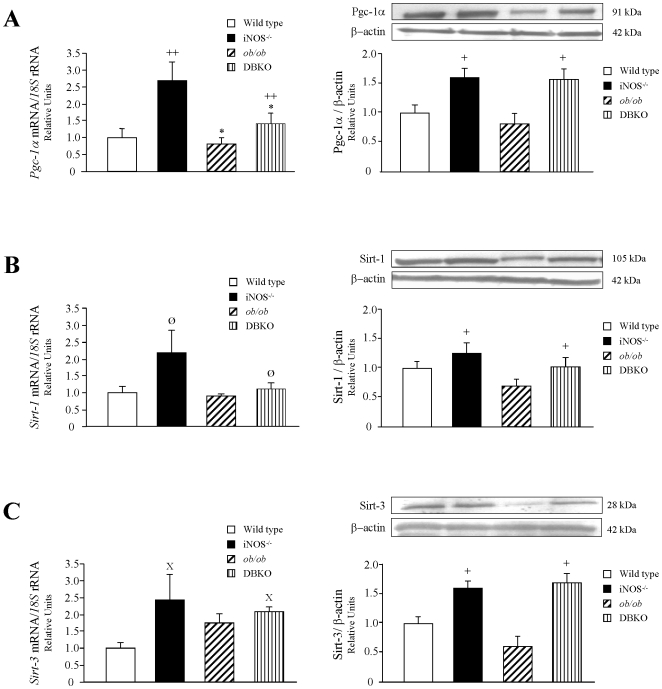
Figure 5. Effect of the lack of both genes on molecules involved in the regulation of thermogenesis.
Bar graphs show the transcript and protein levels of peroxisome proliferator-activated γ coactivator-1 α (PGC-1α) (A), sirtuin-1 (SIRT1) (B), and sirtuin-3 (SIRT3) (C) in BAT of experimental animals. mRNA and protein data were normalized for the expression of 18S rRNA and β-actin, respectively. The expression in wild type mice was assumed to be 1. Representative blots are shown on the top of the histograms. Values are the mean±SEM (n = 6 per group). Differences between groups were analyzed by two-way ANOVA. *p<0.05, effect of the absence of the ob gene. +p<0.05, ++p<0.01, effect of the absence of the iNOS gene. Ø p = 0.089, effect of the absence of the iNOS gene; X p = 0.084, effect of the absence of the iNOS gene.

