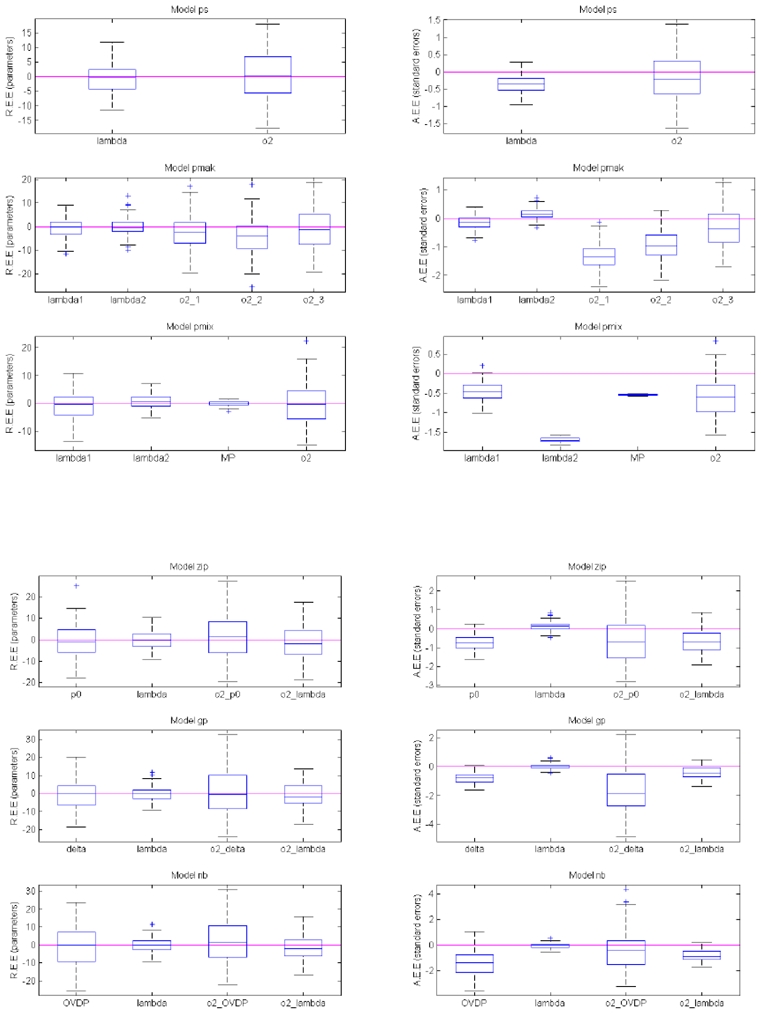
Figure 1.

Distribution of relative estimation error (REE) for all parameters (left panel) and standard errors (right panel) across all the models. The errors (y axes) are given as percentages (%). (Abbreviations: PS = Poisson, PMAK = Poisson with Markovian Features, PMIX = Poisson with a mixture distribution for individual observations, ZIP = Zero-inflated Poisson, GP = Generalized Poisson, and NB = Negative binomial model)
