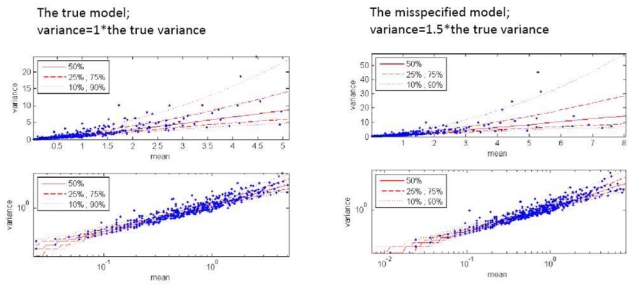
Figure 2.

Visual predictive check of variance versus mean on normal (upper panel) and log (lower panel) scale. Observed data are given as scatter points, while prediction intervals are represented as red lines. VPC is shown for the true (left panel) and for a mis-specified zero-inflated Poisson models, when variance used for simulations is equal to 1.5 the true variance (right panel).
