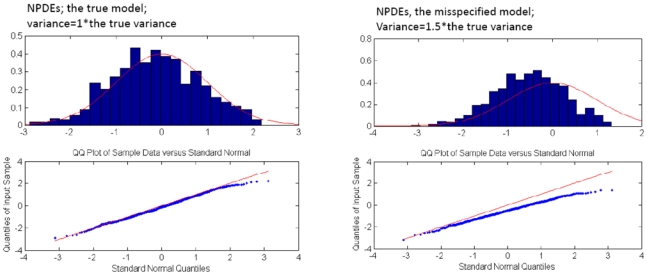
Figure 3.

Comparison of NPDEs and normal distribution with zero mean and variance of one, represented as histogram (upper panel) and q-q plot (lower panel). NPDEs are shown for the true (left panel) and for a mis-specified zero-inflated Poisson models, when variance used for simulations is equal to 1.5 times the true variance (right panel).
