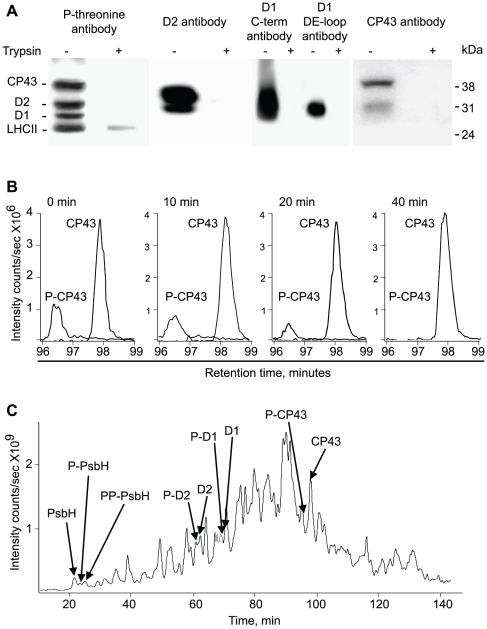
Figure 7. Quantification of PSII core protein phosphorylation using LC-MS.
A, immunoblotting analyses of thylakoid membrane proteins from wild type plants with antibodies against CP43, D2, D1 and phosphothreonine before (−) and after (+) trypsin treatment, as indicated. B, LC-MS extracted ion chromatograms of the phosphorylated and non-phosphorylated N-terminal peptide from the CP43 protein after incubation of the peptide mixture with alkaline phosphatase for different time, as indicated. The ratios of phosphorylated to non-phosphorylated peptide intensities at each time point were used for calculations of CP43 phosphorylation level. C, LC-MS profile of total ion chromatogram with indication of the elution times for peptide/phosphopeptide pairs from PSII core proteins. Experimental procedures as in A, B and C were done for wild type and stn7, stn8, stn7stn8 plants from normal light (4 hours of light) and dark (12 hours of darkness).

