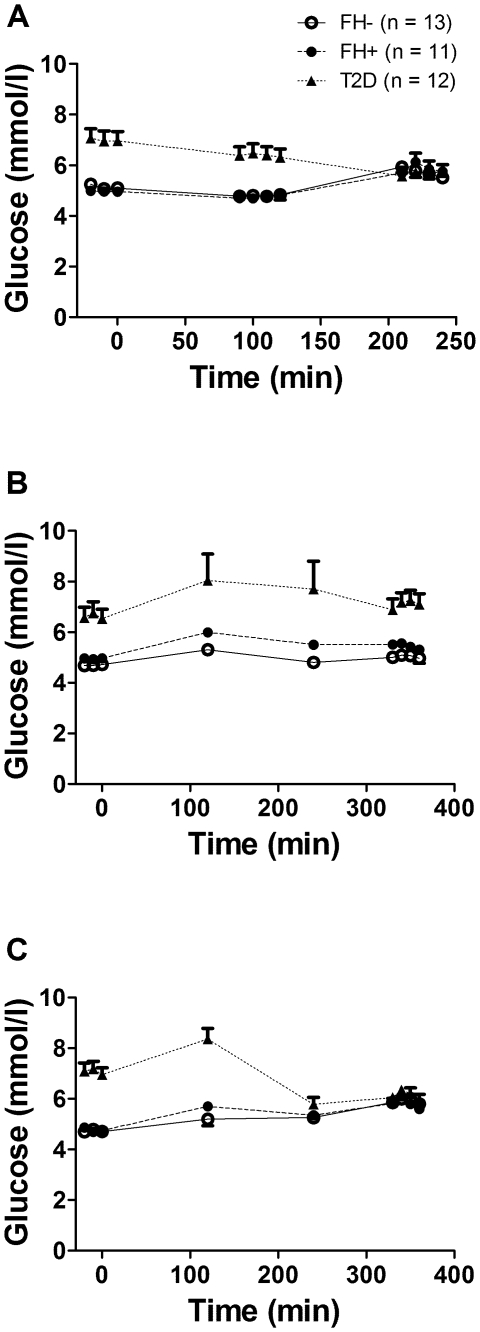
Figure 2. Plasma glucose over time during the experimental protocols.
Plasma glucose levels during the fasting and clamp protocol (A), the postprandial protocol (B) and the postprandial protocol with exogenous insulin infusion (C) in healthy subjects without first-degree family history of type 2 diabetes (open circles, continuous lines), in offspring of both parents with type 2 diabetes (closed circles, dashed lines) and in subjects with established type 2 diabetes (closed triangles, dotted lines). Data are mean ± SEM.

