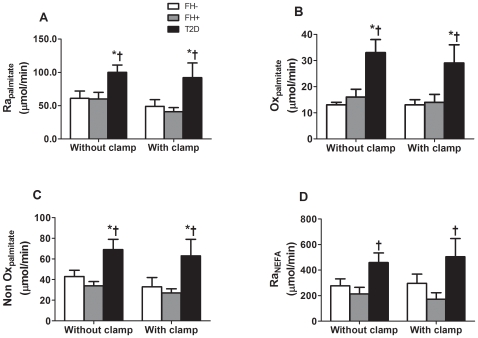
Figure 6. Plasma nonesterified fatty acid (NEFA) metabolism during the postprandial state without and with euglycemic hyperinsulinemic clamp.
Plasma palmitate appearance (Rapalmitate – A), palmitate oxidative metabolism (Oxpalmitate – B), palmitate non oxidative metabolism (NonOxpalmitate – C) and nonesterified fatty acid appearance (RaNEFA – D) in healthy subjects without first-degree family history of type 2 diabetes (FH− – white bars), offspring of both parents with type 2 diabetes (FH+ – grey bars) and subjects with established type 2 diabetes (T2D –black bars). * P<0.05 vs. FH−. † P<0.05 vs. FH+. Adjustment for waist circumference, but not for age, gender, BMI or insulin sensitivity, abolished difference between groups. Data are mean ± SEM.

