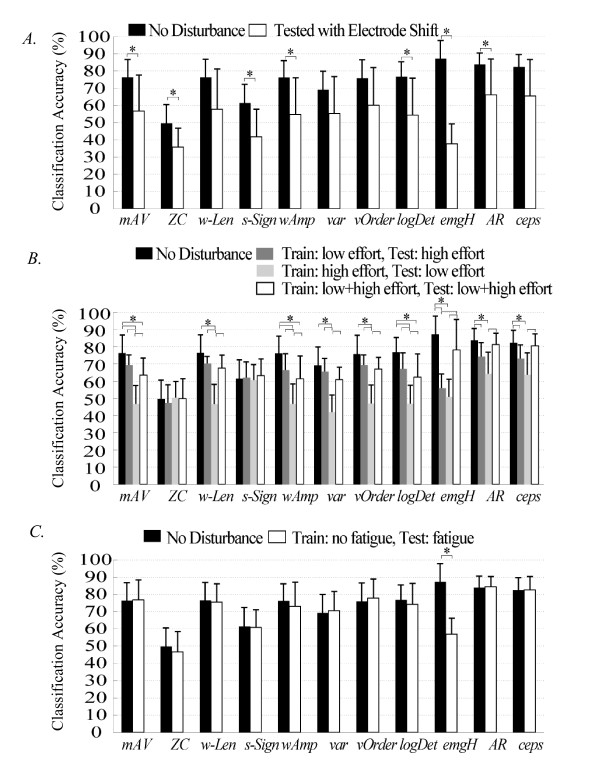
Figure 3.
The effects of (A) location shift, (B) varied muscle contraction effort, and (C) muscle fatigue on the classification performance of individual features. Each bar indicates the mean value of classification accuracy over 8 subjects. The error bars denote one standard deviation. Stars (*) denote statistically significant differences by one-way ANOVA (P <0.05).

