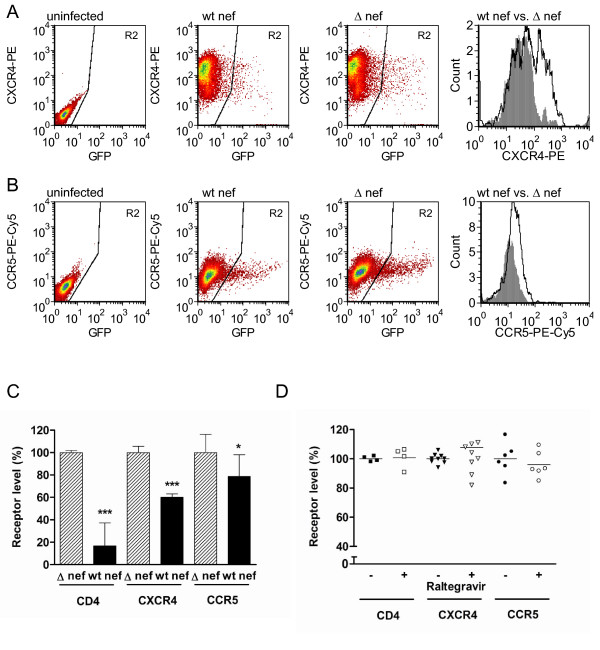
Figure 4.
Nef-mediated downregulation of cell surface CXCR4, CCR5 and CD4 by IV-1 infection in the presence of raltegravir. A. FACs plots demonstrating analysis of cells infected with wt integrase virus in the presence of 1 μM raltegravir. GFP-positive (infected) cells are depicted in gate R2. Cells infected with Δ-nef virus demonstrate higher expression of CXCR4 than occurs for wt nef virus. The histogram shows a direct comparison of CXCR4 levels for wt nef virus (shaded grey) vs. Δ-nef virus (black line, white background). B. Cells infected with Δ-nef virus in the presence of 1 μM raltegravir demonstrate higher-level expression of CCR5 than cells infected by wt nef virus. The histogram shows a direct comparison of CCR5 levels for wild-type nef virus (shaded grey) vs. Δ-nef virus (black line, white background). C. Cells infected with wt virus containing either a wt nef or the Δ-nef mutation in the presence of raltegravir were analyzed relative to uninfected cells for the presence of cell surface CD4, CXCR4 and CCR5. Geometric means of fluorescence for each receptor are expressed relative to infection by the Δ-nef virus. Results are from 3-5 independent experiments, each performed in duplicate. Error bars indicate standard deviations. For each receptor, statistical comparisons between wt nef and Δ-nef viruses were made by two-tailed unpaired t-tests, p < 0.001 (***), p < 0.05 (*). D. 1 μM raltegravir does not directly influence cell surface levels of CD4, CXCR4 and CCR5. Uninfected cells were treated in the presence or absence of 1 μM raltegravir and then stained for CD4, CXCR4 or CCR4. Plots display expression levels relative to untreated cells. Results are from 3-5 independent experiments, each performed in duplicate. For each receptor, statistical comparisons between untreated and treated cells were made by two-tailed unpaired t-tests. No statistically significant differences were found.

