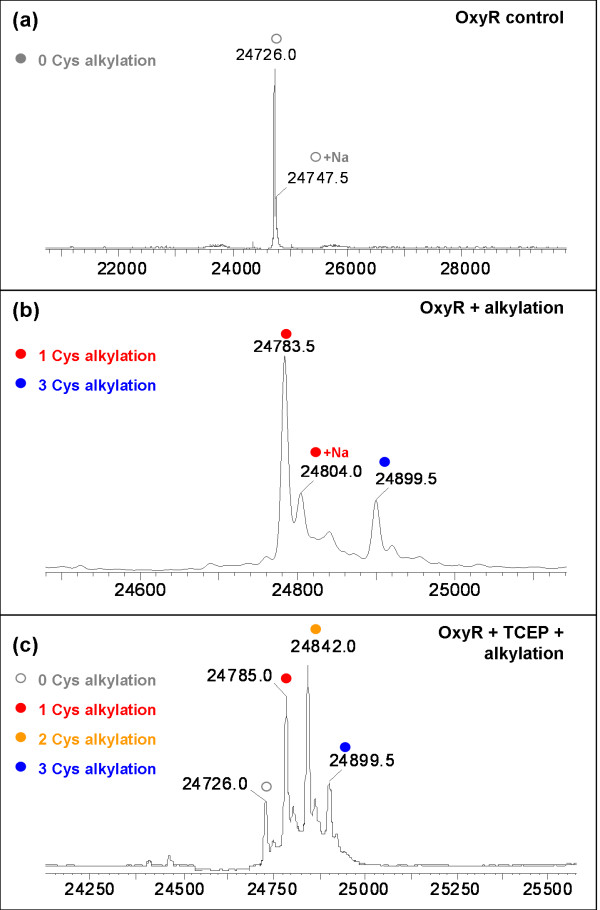
Figure 1.
Alkylation and MS analysis of the oxidation state of the cysteine residues of the neisserial OxyR. Spectra: (a) OxyR control; (b) OxyR after alkylation with iodoacetamide; (c) OxyR after alkylation with iodoacetamide following prior reduction with TCEP. Minor peaks are sodium adducts of the corresponding, labelled major peaks. OxyR protein at 1 mg/ml in 20 mM Tris pH 7.5, 200 mM NaCl was incubated with/without the addition of TCEP to 2 mM at 37°C for 30 min. An equal volume of alkylating buffer (20 mM Tris pH 7.5, 0.1 mM EDTA, 20 mM iodoacetamide) was added and the samples were incubated for a further 1 h. The samples were analysed using electrospray mass spectrometry using a Dionex Ultimate liquid chromatography system connected to a Waters Q-Tof Micro mass spectrometer [24].

