Figure 3.
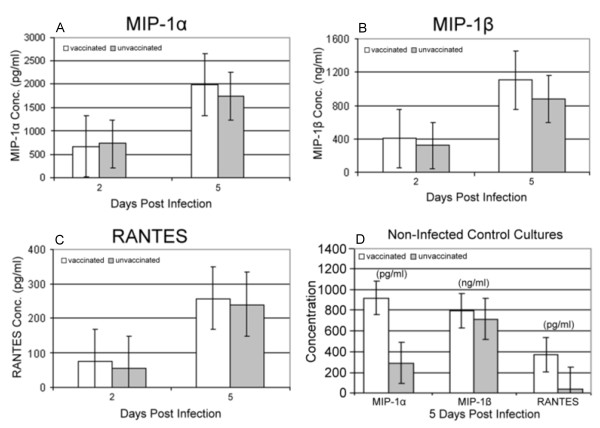
Chemokine analysis in culture supernatants. Comparison of MIP-1α (a), MIP-1β (b) and RANTES (c) release between the PBMCs from vaccinated (N = 9) and unvaccinated (N = 10) subjects on days 2 and 5 post culture inoculation with HIV-1ADA. No significant difference between the vaccinated and unvaccinated subjects is apparent. Figure 3d shows chemokine levels from non-infected control cultures (N = 2 for each group) on culture day 5. There is a trend toward a higher baseline chemokine production in the vaccinated subjects, though it is not statistically significant.

