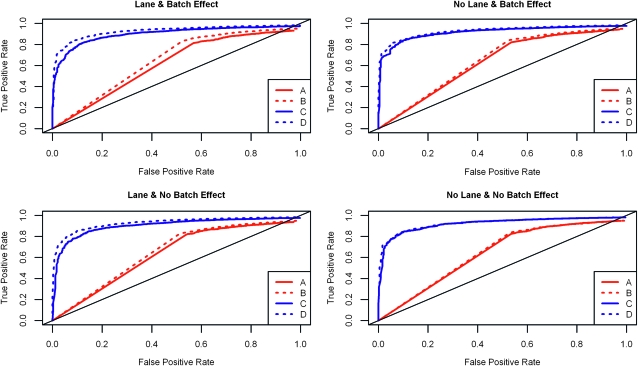
Figure 8.—
ROC curves for the within-group variability setting  . The x-axis represents the false positive rate and the y-axis represents the true positive rate. The four panels of the graph show results for each of the four simulation settings. The ROC curve for the unblocked unreplicated design (A) is in solid red, for the blocked unreplicated design (B) is in dotted red, for the unblocked replicated design (C) is in solid blue, and for the blocked replicated design (D) is in dotted blue. The replicated designs always outperform the unreplicated designs, and whenever there is a batch effect or a lane effect, the blocked designs outperform their unblocked counterparts.

