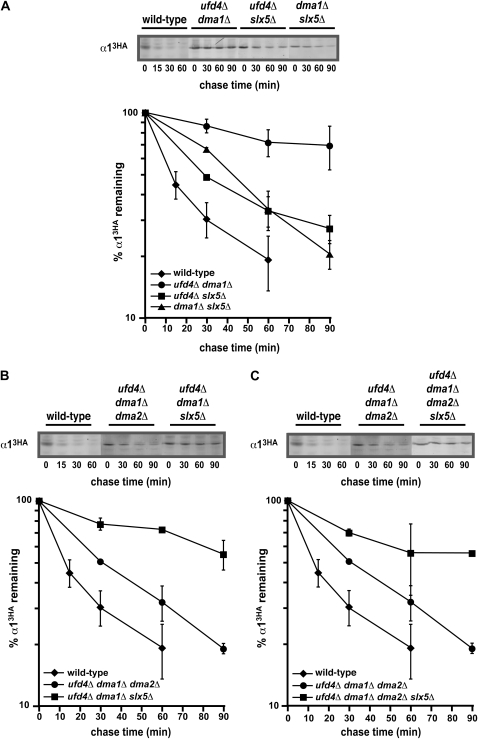
Figure 5.—
Genetic interactions among the α1 degradation pathways. (A) A representative cycloheximide-chase assay of α13HA turnover at 30° in wild-type, ufd4Δ dma1Δ, ufd4Δ slx5Δ, and dma1Δ slx5Δ cells is shown at the top, and the quantitative results of multiple experiments are shown below. (B) Cycloheximide-chase analysis of α13HA turnover at 30° in wild-type, ufd4Δ dma1Δ dma2Δ, and ufd4Δ dma1Δ slx5Δ cells. A representative experiment is shown at the top, and the quantitative results of multiple experiments are shown below. (C) A representative cycloheximide-chase assay of α13HA turnover at 30° in wild-type, ufd4Δ dma1Δ dma2Δ, and ufd4Δ dma1Δ dma2Δ slx5Δ cells is shown at the top, and the quantitative results of multiple experiments are shown below. The data for ufd4Δ dma1Δ dma2Δ cells from B are included for comparison.

