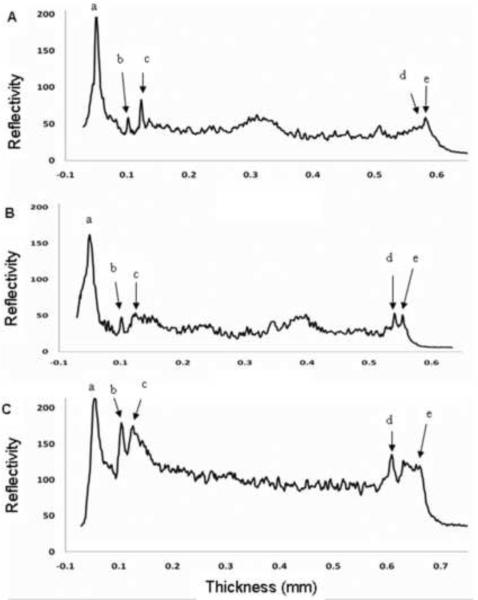
Figure 2. Reflectivity profiles of ultra high resolution optical coherence tomography (UHR-OCT) images of young normal, elderly normal and Fuchs' dystrophy corneas.
Each profile was created by averaging the UHR-OCT A-scan data for the central 2 mm of the corneas shown in Figure 1. Peaks were identified and correlated to the different corneal layers. The interval from (a) to (b) represents epithelium, while from (b) to (c) represents Bowman's layer. The stroma is represented by the interval from (c) to (d). The thickness of Descemet's membrane was calculated as the distance from (d) to (e). The measured thicknesses of Descemet's membrane were 9 μm for the normal young subject (A), 17 μm for the normal elderly subject (B), and 55 μm for the right eye of Fuchs' dystrophy patient number 5 (C). For the Fuchs' dystrophy patient (C), the reflectivity profile of the corneal stroma was greater than that in the normal subjects (A and B), probably due to corneal edema. The posterior line of the Descemet's membrane in (C) had multiple small spikes that correlated with its irregular appearance on the UHR-OCT image.

