
Figure 4. Activation of NF-κB in CRCL treated DC and macrophages.
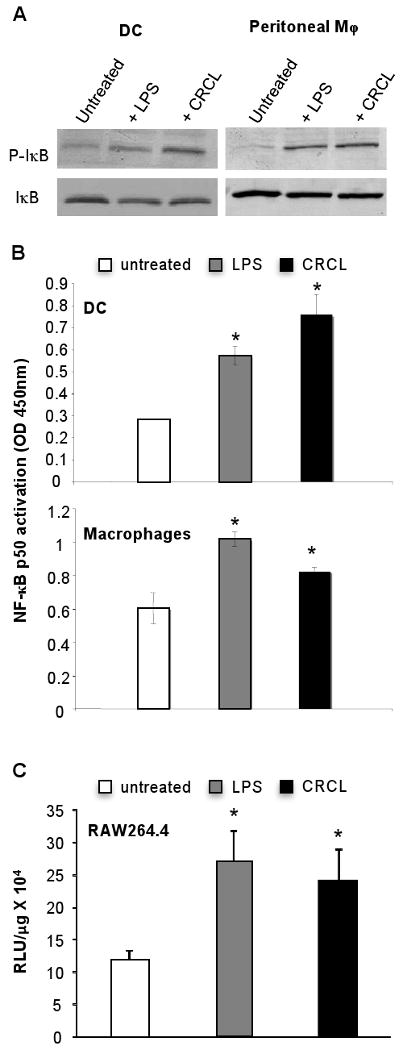
(A) Day 5 bone marrow derived DC or peritoneal macrophages were incubated for 24 hrs with CRCL (25 μg/ml). Total cell extracts were performed and phospho-IκB or IκB expression was analyzed by Western blot. Untreated cells were used as a negative control and cells treated with LPS (1 μg/ml) were used as a positive control. (B) Day 5 bone marrow derived DC or peritoneal macrophages were incubated for 24 hrs with CRCL. Nuclear extracts were performed and the DNA binding activity of NF-κB p50 to a consensus DNA probe was assessed as described in materials and methods. DC or macrophages cultured alone were used as a negative control, and cells treated with LPS were used as a positive control. The data are shown as a mean ± SD of duplicate wells of NF-κB p50 activation determined as the OD value 450nm as indicated by the manufacturer. (C) RAW264.7 cells were transiently transfected with a NF-κB luciferase plasmid. After 36 hrs, cells were treated with LPS or CRCL for 12 hrs as indicated and a luciferase assay was performed as described in material and methods. Data are presented as Relative Luminescent Unit (RLU)/μg of protein. Results are representative of three independent experiments. *, a significant difference when compared to untreated control cells (p < 0.05).