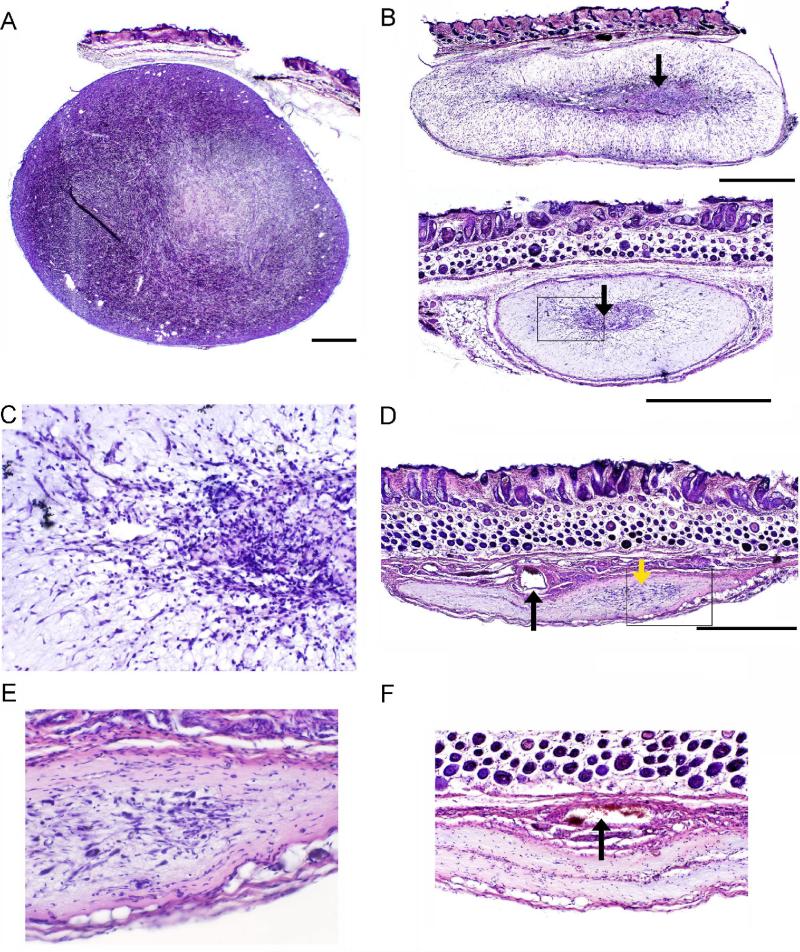
Fig. 2.
Histopathological analysis of PVS-RIPO-induced oncolysis of HTB-15 xenografts in athymic mice [57]. The bar shown with low-magnification images represents 1 mm. (A) Crosssection of a vehicle-injected tumor in an animal sacrificed 40 days after tumor implantation. The xenograft displays typical dense, hyper-cellular morphology. (B) Representative xenografts 10 days post PVS-RIPO inoculation. Only a minor, central portion of the xenograft retains the characteristic appearance of tumor (arrows). The boxed region is shown at higher magnification in (C). (C) Detail of (B) (bottom panel). Dense infiltrates surrounding and invading the central part of the xenograft can be distinguished at higher magnification. (D) Overview of a HTB-15 xenograft 28 days after PVS-RIPO inoculation. A scar had replaced the tumor, but a minor focus of remaining active tissue re-arrangement is visible (yellow arrow). A large patent vessel (black arrow) and surrounding collapsed minor vessels may represent the former tumor's vascular supply. The boxed region is shown at higher magnification in (E). (E) Detail of (D) showing the area of active tissue re-modeling at higher magnification. (F) Two out of 4 tumors had entirely been eliminated 28 days post PVS-RIPO and replaced by a scar. The remnants of several large vessels are visible at the center of the scar's base (arrow).

