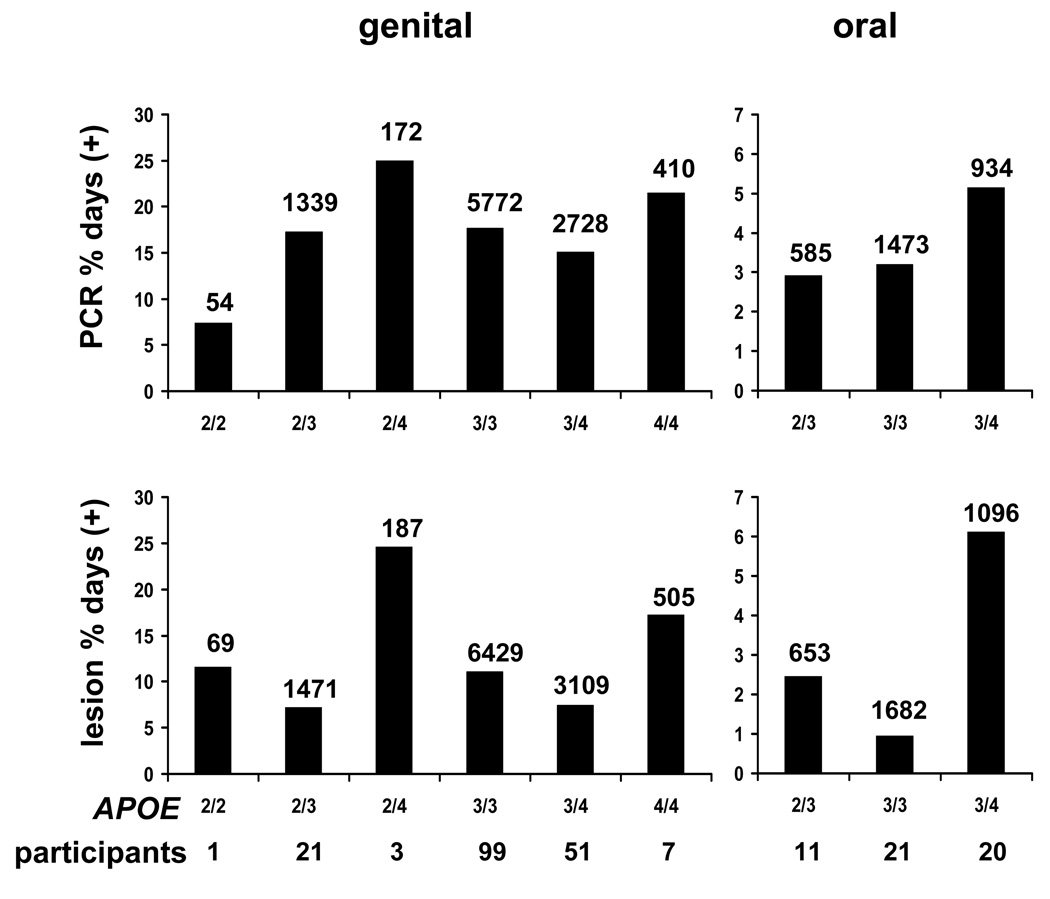
Fig. 1.
Association of APOE genotypes and oral HSV shedding and oral lesions. The left bars refer to genital shedding rates (top) and lesion rates (bottom), while the right bars depict oral shedding (top) and lesions (bottom). The abscissa values differ between genital and oral sites. The numbers of days with data available are indicated over the bars for each genotype, anatomic site, and study endpoint. The number of persons with each genotype is listed below the APOE genotypes across the ordinates.

