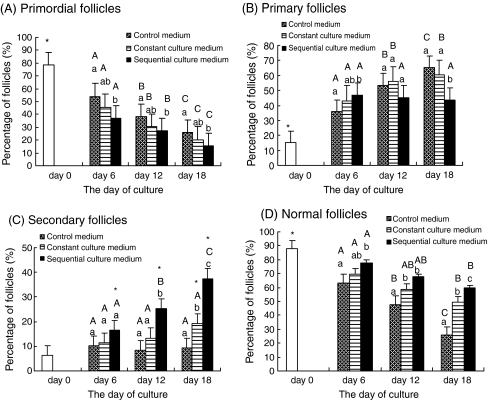
Fig. 1.
The percentage of a primordial; b primary; c secondary; and d normal follicles at 0, 6, 12, and 18 days after culture. Note: * – Significantly different from non-cultured tissue (P < 0.05). a, b, c – Significantly different between culture media on the same day of culture (P < 0.05). A, B, C – Significantly different between days of culture in the same medium (P < 0.05)

