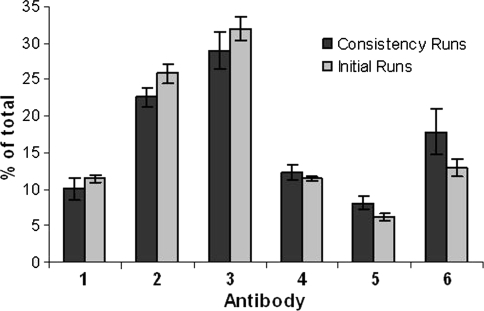
Fig. 7.
Comparison of the relative area of the individual anti-RSV antibodies from two independent sets of fed batch production runs performed with rpAb composition I. The dark bars represent the average antibody concentration of four parallel consistency runs. The light bars represent the average antibody concentration of the duplicate runs initially performed with composition I (see Fig. 6a). Samples for CIEX profiles were taken at day 10 (right bars) and day 12 (left bars). The standard deviation is indicated as error bars

