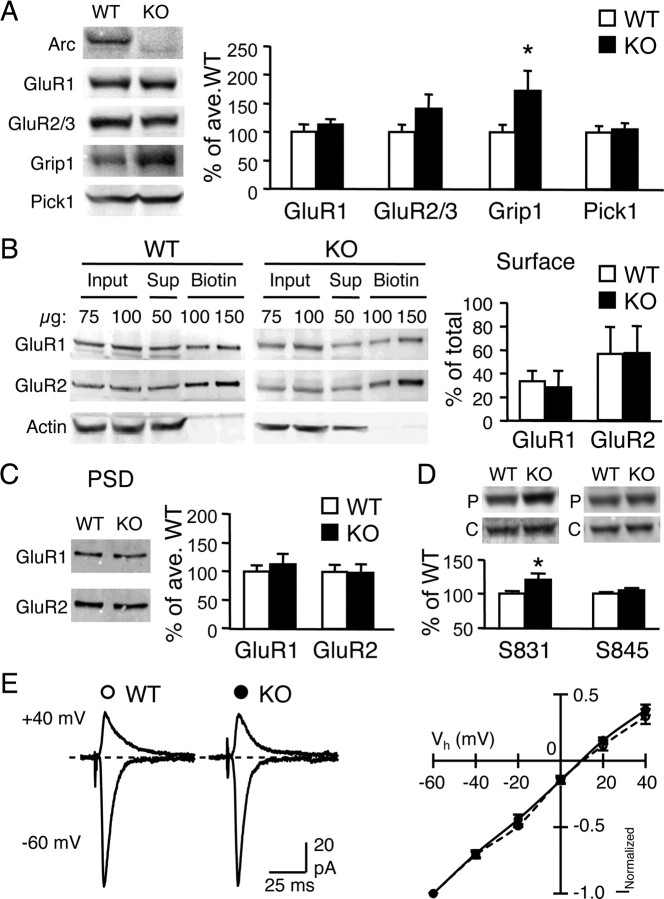
Figure 2.
Comparison of AMPAR and associated proteins in the visual cortex of Arc/Arg3.1 KO and WT. A, Immunoblot analysis of AMPAR subunits (GluR1 and GluR2/3) and associated proteins (Grip1 and Pick1). Left, Representative immunoblots of WT and KO visual cortex homogenates probed with antibodies against Arc, GluR1 C terminal, GluR2/3 C terminal, Grip1, and Pick1. Right, Quantification of immunoblots. The band intensity was normalized to that of the average WT values to obtain percentage of average WT values. *p < 0.05, t test. B, Surface levels of GluR1 and GluR2 subunits measured by steady-state surface biotinylation in visual cortical slices of WT and KO. Left, Example immunoblots of total homogenate (Input), supernatant (Sup), and biotinylated (Biotin) samples probed with antibodies against GluR1 C terminal (top), GluR2 N terminal (middle), and actin (bottom). The absence of actin in the biotin lanes confirms the specificity of biotinylation of surface proteins. Right, Quantification of surface GluR1 and GluR2. The signals of the input lanes and the biotin lanes were used to calculate the percentage of total GluR1 and GluR2 on the surface (% of total). C, GluR1 and GluR2 levels in the isolated PSD fractions of WT and KO were not significantly different. Left, Representative immunoblots probed with GluR1 C-terminal and GluR2 N-terminal antibodies. Right, Quantification of the immunoblot signals. D, Increase in GluR1 phosphorylation on S831 (left), but not S845 (right), in visual cortex of Arc/Arg3.1 KOs. Top, Representative blots probed with phospho-specific antibodies (P) and GluR1 C-terminal antibody (C). E, No difference in AMPAR I–V relationship measured from L2/3 neurons during L4 stimulation. Left, Example superimposed traces taken at Vh of −60 mV (inward current) and +40 mV (outward current). Right, I–V curve plotting AMPAR current amplitude at different Vh. Open circles, WT; filled circles, KO.

