Figure 3.
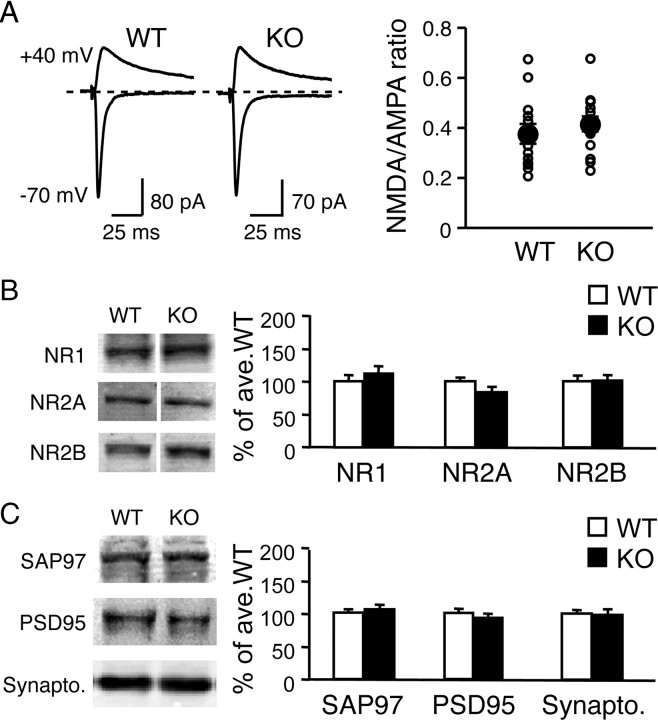
Comparison of NMDAR function and key synaptic proteins in visual cortex. A, Normal NMDAR-EPSC to AMPAR-EPSC ratio in Arc/Arg3.1 KOs. Evoked EPSCs were measured in L2/3 pyramidal neurons after L4 stimulation. Left, Superimposed representative EPSC traces measured at −70 mV (AMPAR-EPSC) and +40 mV (compound EPSC of AMPAR and NMDAR). The size of AMPAR response was measured as the peak amplitude at −70 mV, and the magnitude of NMDAR response was measured at three times the AMPAR decay time constant (τ) at +40 mV. Right, Comparison of average NMDAR/AMPAR ratio of WT and KO. NMDAR/AMPAR ratio values from individual cells are plotted as small open circles. The average values are shown in filled circles, with error bars denoting SEM. B, Arc/Arg3.1 KOs expressed normal levels of NMDAR subunits NR1, NR2A, and NR2B in the total homogenate of visual cortex. C, The expression levels of postsynaptic proteins SAP97 and PSD95 and a presynaptic protein synaptophysin (Synapto.) were normal in KOs.

