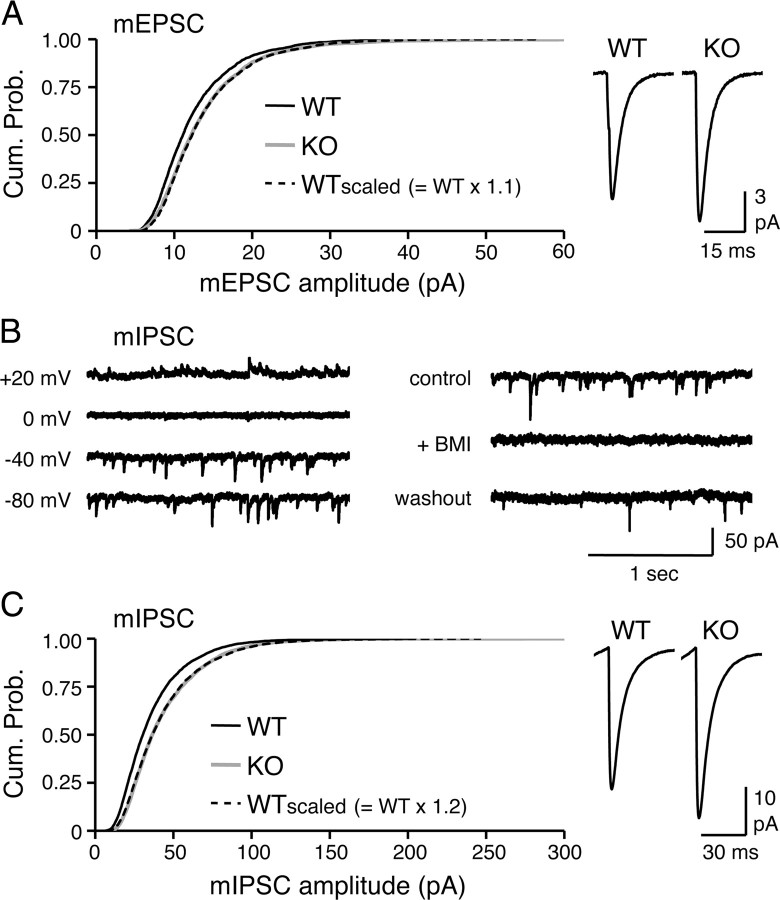
Figure 4.
Arc/Arg3.1 KOs display larger basal mEPSCs and mIPSCs in L2/3 pyramidal neurons of visual cortex. A, Comparison of mEPSCs recorded from P23 normal-reared WT and KO. Left, Multiplicative increase in mEPSC amplitude of KO compared with WT. The cumulative probability curve of WT mEPSC amplitudes (black solid line) multiplied with a scaling factor (WTscaled, scaling factor of 1.1; black dashed line) superimposed with that of KO (gray solid line) (K–S test, p > 0.3). Right, Average mEPSC traces from WT and KO. *p < 0.05, t test. B, Left, Verification that the internal solution used reverses mIPSCs at 0 mV. Each trace was recorded under different holding voltage as indicated. Right, The pharmacologically isolated mIPSCs are blocked by addition of 20 μm bicuculline (+BMI). C, Comparison of mIPSCs recorded from P23 normal-reared WT and KO. Left, Larger mIPSC amplitude in KOs is multiplicative to that of WTs. Cumulative probability curve of mIPSC amplitude of WTscaled (scaling factor of 1.2; black dashed line) overlapped with that of KO (gray solid line). WT, Black solid line. Right, Average mIPSC traces. *p < 0.03, t test.

