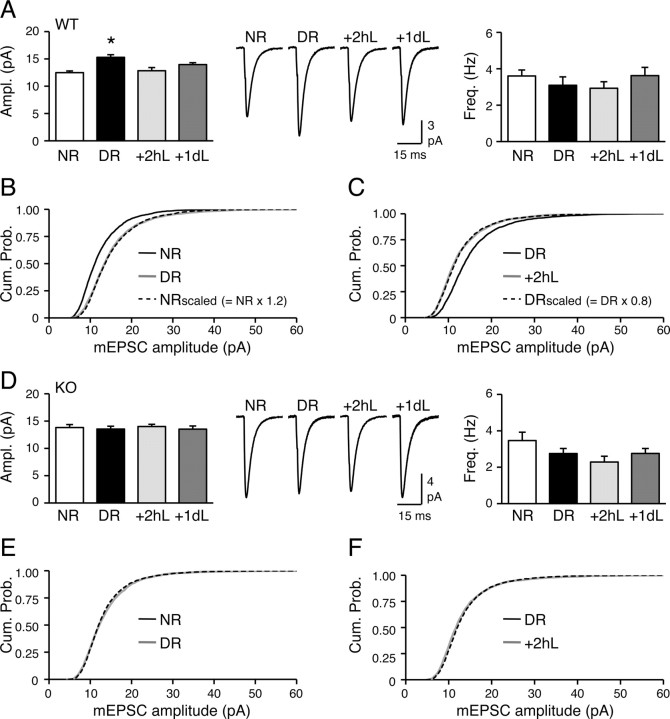
Figure 5.
Absence of visual experience-induced homeostatic plasticity of mEPSCs in L2/3 of Arc/Arg3.1 KO visual cortex. A, Bidirectional synaptic scaling in WT. Left, Two days of DR increased mEPSC amplitude, and reexposure to light for 2 h (+2hL) or 1 d (+1dL) reversed this. Middle, Average mEPSC traces from the four groups. Right, No change in mEPSC frequency (ANOVA, F(3,57) = 0.7, p > 0.5). *p < 0.01, Fisher's PLSD post hoc test. B, Multiplicative scaling up of mEPSCs with DR in WT. The cumulative probability curve of NRscaled [black dashed line, multiplying mEPSCs from NR (black solid line) with a scaling factor of 1.2] overlapped with that of DR (gray solid line). C, Multiplicative scaling down of mEPSCs with 2 h of light reexposure (+2hL) in WT. The cumulative probability curve of DRscaled (black dashed line; DR mEPSCs multiplied by a scaling factor of 0.8) overlapped with that of +2hL (gray solid line). DR, Black solid line. D, Visual experience failed to alter mEPSCs in KOs. Left, No change in mEPSC amplitude with DR, +2hL, or +1dL. Middle, Average mEPSC traces from the four groups. Right, No significant change in mEPSC frequency (ANOVA, F(3,53) = 2.3, p > 0.08). E, No change in mEPSC amplitude distribution between NR and DR KOs. F, No change in mEPSC amplitude distribution between DR and +2hL KOs.

