
Figure 2.
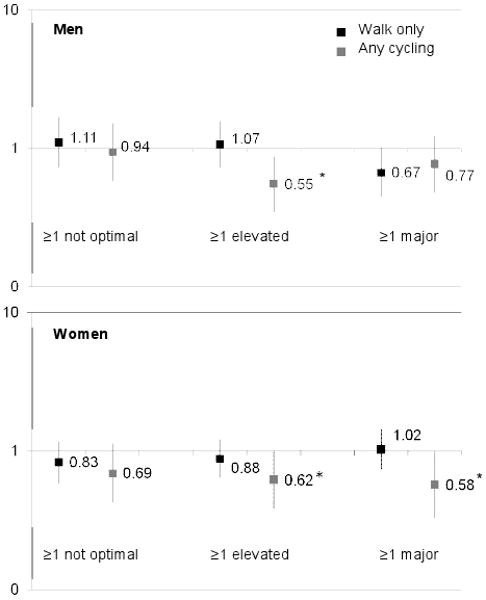
Odds ratios for walking-only and any cycling to any amenity and risk strata for lifetime CVD risk classificationa
aExam Year 20 (2005-06) of the Coronary Artery Risk Development in Young Adults (CARDIA) Study. Estimated from multinomial regression, adjusted for age, race, education, income, alcohol intake, physical activity other than walking and bicyling, “other” transit modes to any neighborhood amenity, and study center. Dependant variable categories were lifetime CVD risk classifications (“all optimal risk factors”, “≥1 not optimal risk factor”, “≥1 elevated risk factor”, and “≥1 major risk factor”) defined in footnote under Table 1. Odds ratios tabulated are relative to “all optimal risk factors”. Error bars represent 95% confidence intervals.
*significant (p<0.05)