
Figure 1.
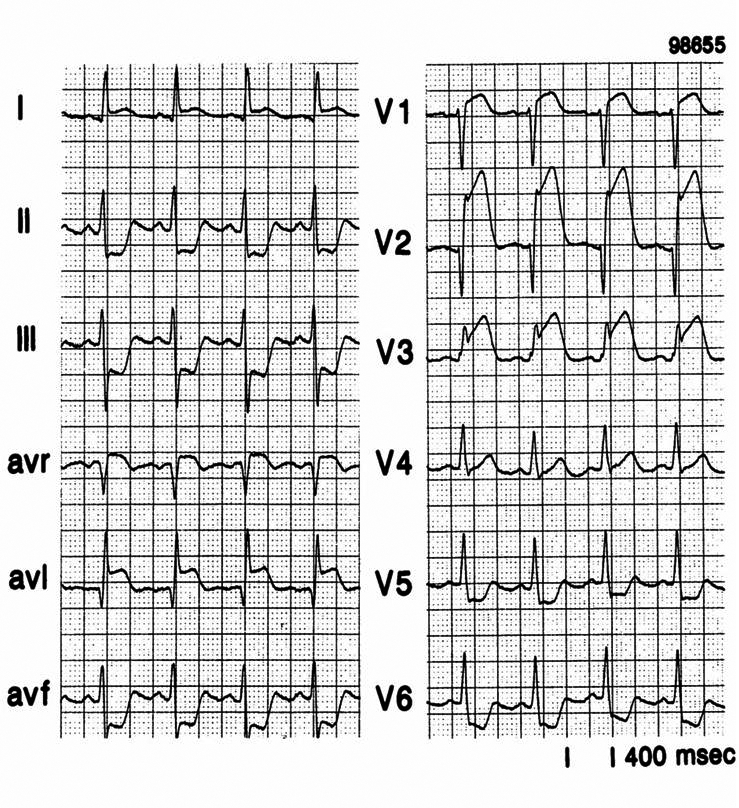
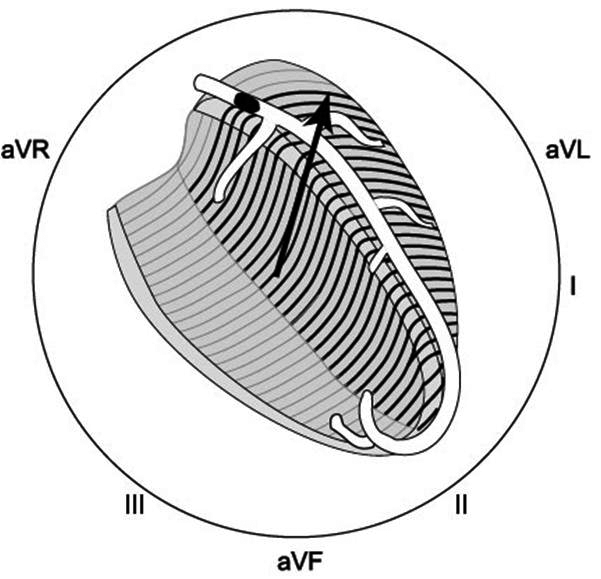
An example of the ST-segment deviation behaviour in a patient with an acute anterior wall myocardial infarction because of an occlusion in the left anterior descending coronary artery proximal to the first septal and the first diagonal branch. On the left the 12-lead ECG, on the right the ST-segment deviation axis in the frontal plane. The axis goes from the leads showing ST-segment depression to the leads showing ST-segment elevation.