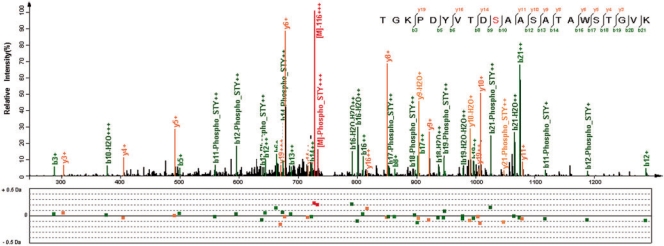
Fig. 6.
A spectrum from a phosphorylated peptide. This triply charged spectrum was identified to have the peptide sequence of TGKPDYVTDSAASATAWSTGVK, with a ΔM of 79.97 Da that implies a phosphorylation. The modified site is the 10th amino acid residue (the first serine) from the N-term. The neutral loss peaks of precursor ions by masses of −98 and −116 Da are obvious, and there are also many neutral loss peaks of product ions by −98 Da. These features are typical for spectra of phosphorylated peptides. Most of intensive peaks are explained with low m/z errors.

