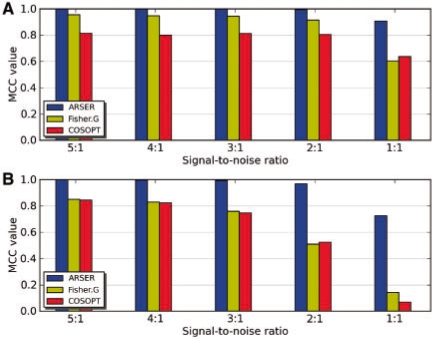
Fig. 2.
Accuracy of ARSER, COSOPT and Fisher's G-test at identifying (A) stationary and (B) non-stationary periodic signals under decreasing signal-to-noise ratio. For each group of periodic signals, there are 1:1 negative sample data generated by (μ=0, σ=1) white noise. The performance is measured by MCC. As noise intensity increased, ARSER (blue) performed robustly with noise in both situations, while COSOPT (red) and Fisher's G-test (yellow) performed badly for stationary periodic signals with high-level noise and even worse for non-stationary ones. They all scored the signals as periodic using the threshold of 0.05 for FDR q-value for ARSER and Fisher's G-test, or by pMMC-β for COSOPT. pMMC-β measures the probability for multiple testing, similarly to the FDR q-value.

