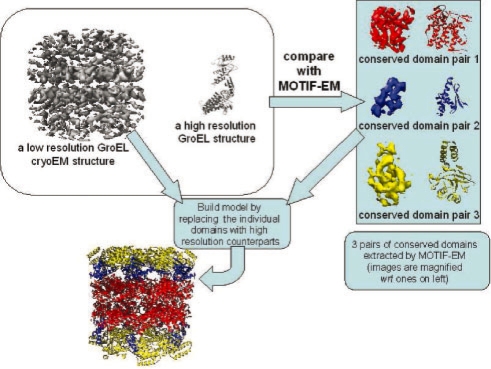
Fig. 10.
Model building. The open conformation GroEL cryoEM map and a closed conformation GroEL high-resolution model (top, left block) were compared using MOTIF-EM to yield three pairs of conserved domains (top, right block; images are magnified wrt left block ones). The conserved domains in the GroEL cryoEM map were replaced with corresponding conserved domains in the high-resolution model, to yield a high-resolution model for the GroEL cryoEM map (left, bottom).

