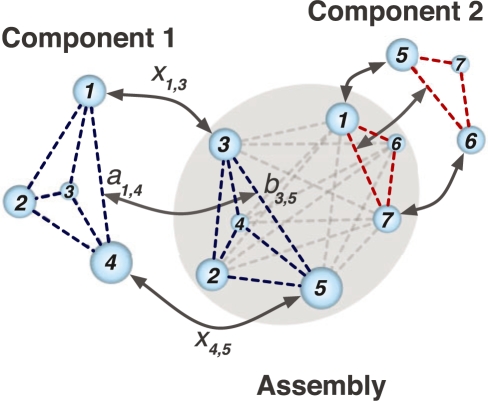
Fig. 2.
An illustration of the feature point matching procedure. The goal is to match simultaneously the point sets of Component 1 and Component 2 with the Assembly point set. All point sets are shown as spheres, where the size of a sphere represents the averaged density value in a defined volume of the density map, which is within five grid voxels of the corresponding feature point. The dashed lines between the spheres represent all possible distances within each component and within the assembly. aik and bjl are the distances between points i and k in Component 1 and points j and l in the Assembly, respectively. The value of the binary variable xij is set to 1 if point i in Component 1 matches with point j in the Assembly and xij is set to zero otherwise. Correspondingly, the product xijxkl is 1 if distance aik in Component 1 matches with distance bjl in the Assembly and is 0 otherwise. The aim of IQP is to find the best matching xij with maximized IQP score F(U1, U2, V1, V2) (see Section 2).

