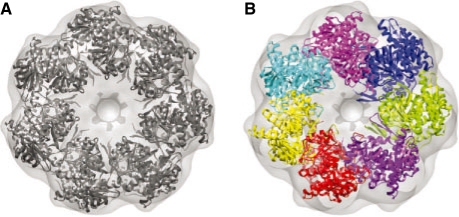
Fig. 3.
Simultaneous fitting of all seven components of the APO-GroEL into the experimental density map of GroEL-GroES at 23.5 Å resolution. (A) Experimental map and fitted atomic model, as provided by Ranson et al. (2001). (B) Fitted component structures with an RMS error of 8.6 Å with respect to the native structure in (A).

