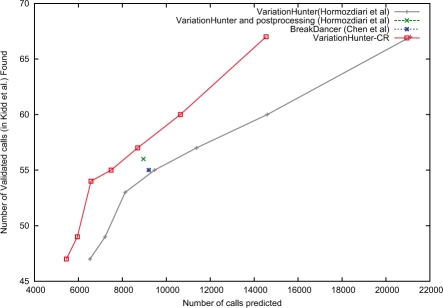
Fig. 6.
Prediction performance comparisons of VariationHunter (black), VariationHunter-CR (red) and BreakDancer (blue). We also show the curated (post-processed) results of VariationHunter in this figure (green). The x-axis represents the number of deletions predicted by each method, and y-axis is the number of validated deletions from (Kidd et al., 2008) that overlaps (>50% reciprocal overlap) with a prediction. It is desirable to obtain a prediction set that is able to find more validated calls with less number of total calls. For VariationHunter and VariationHunter-CR, we give the number of calls and number of validated deletions found for different support levels (number of paired-end read supporting them); less support level results in more predicted deletion intervals. This figure shows that VariationHunter-CR has a better performance than VariationHunter for all support levels, and VariationHunter-CR outperform the BreakDancer algorithm (Chen et al., 2009).

