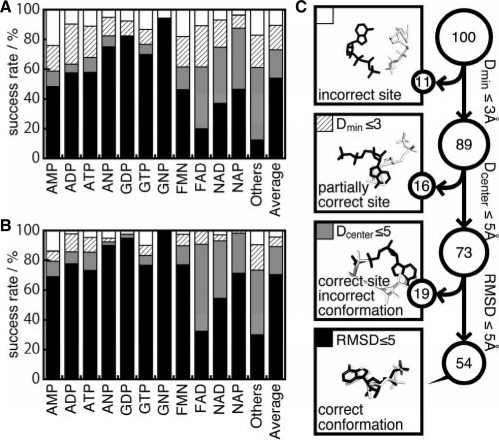
Fig. 2.
Summary of the prediction accuracies for the nucleotide and the chemically diverse datasets. (A and B) Success rates of the first-ranked conformation, and the best in the top 10 conformations, respectively. The first 11 bars indicate the results of each ligand in the nucleotide dataset. ‘Others’ is the result of the chemically diverse dataset. ‘Average’ is the mean value among the other 12 bar plots. (C) Schematic representation of the success rates for ‘Average’ in panel A). All of the predicted conformations can be classified in four categories. Among the predictions, 11% were categorized as predicted conformations located far from the native binding site, 16% were predicted to partially use the same binding sites, 19% were predicted as using the same binding sites but with different binding conformations, and the remaining 54% were correctly predicted, with the same binding sites and conformations as those in the top-ranked prediction. For the top 10 ranked predictions, these ratios were 3%, 7%, 19% and 71%, respectively.

