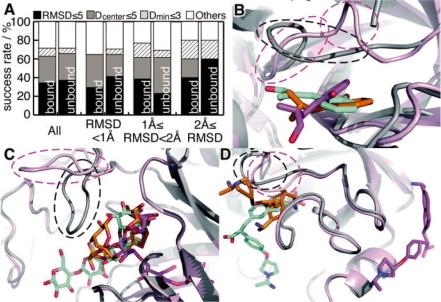
Fig. 5.
The prediction results for the unbound dataset. (A) Success rates of the prediction as a first-ranked prediction, in same manner as Figure 2. ‘All’ means the results for all of the entries in the dataset. The others show the results for each subset, which were divided according to the RMSD value of all atoms in their binding site residues between the bound and unbound forms. Panels B, C and D are screen shots of the prediction results of 3gch/1chg, 1byb/1bya and 1mtw/2tga, respectively. The protein structures in the bound and unbound states are shown by gray and pink ribbons, respectively. The predicted ligand conformations for the proteins in the bound and unbound states are shown by orange and purple sticks, respectively. The native conformations of the ligands are shown by cyan sticks. Remarkable conformational changes induced by ligand binding are highlighted by dashed circles.

