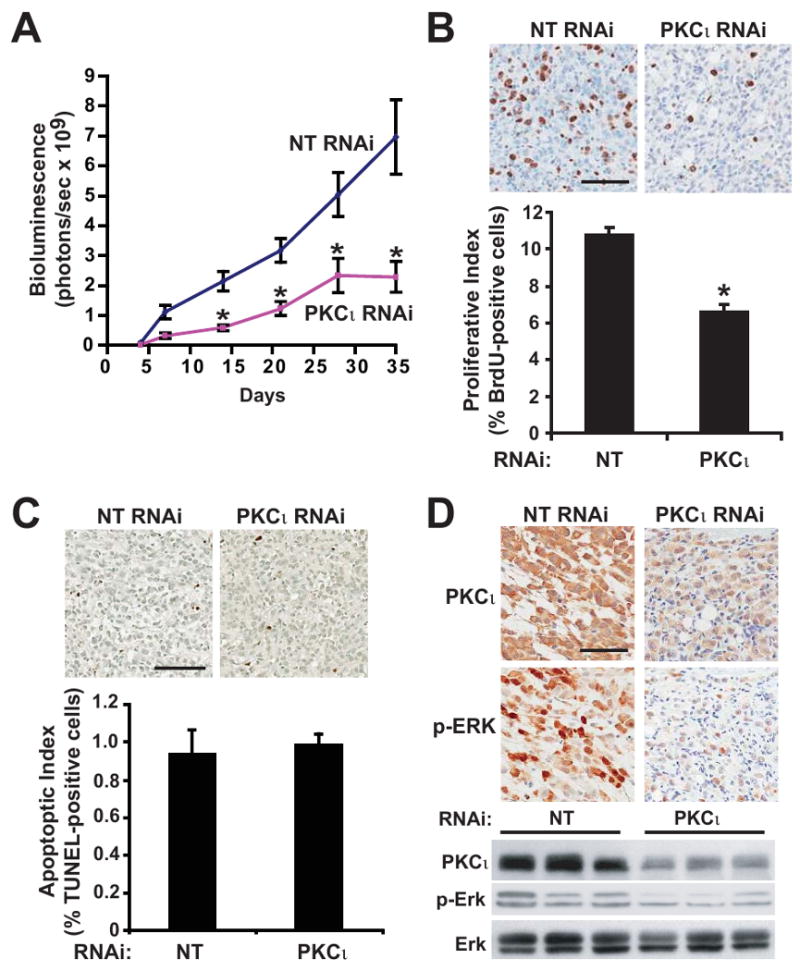
Figure 5. Inhibition of PKCι blocks orthotopic pancreatic tumor proliferation and proliferative signaling.

A) Tumor growth was monitored by bioluminescence (total flux, photons/sec) detected by IVIS imaging of orthotopic Panc-1 NT versus Panc-1 PKCι RNAi pancreatic tumors in live, anesthetized mice at weekly intervals after tumor implantation. n=15, 16/group. *= significantly different than NT RNAi tumors. B) Top: Immunohistochemical analysis of BrdUrd incorporation. Bar=100μm. Bottom: Quantitative analysis of BrdUrd incorporation into Panc-1 tumors. Mean+/-SEM is plotted. C) Top: Immunohistochemical detection of TUNEL staining in representative tumors. Bar=100μm. Bottom: Quantitative analysis of TUNEL staining. Mean+/-SEM is plotted. D) Representative images of IHC detection of PKCι and p-ERK1/2 (Thr 202/Tyr 204) in NT and PKCι RNAi tumors. Bar=100μm. Representative immunoblot analysis of PKCι, p-ERK1/2 (Thr 202/Tyr 204) and ERK1/2 in Panc-1 NT and PKCι RNAi orthotopic pancreatic tumors. Equivalent amounts of protein from each tumor sample were analyzed.
